|
|
Reports
Assess the quality of the schedule using the data reports and charts in xPect Schedule View.
float distribution
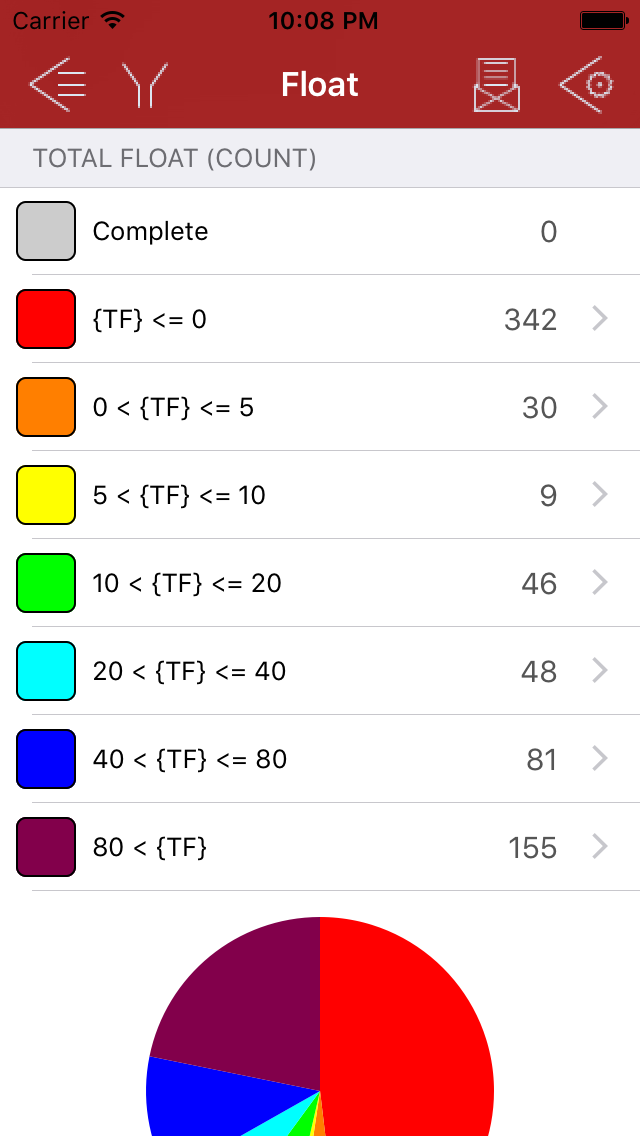 |
Change the chart type by tapping a button on the toolbar: Pie, Bar, Stacked Bar, Column, Stacked Column
Note chart only displays distribution for current filter, tap the "Activity Table" button to return to see which activities are included
|
dates
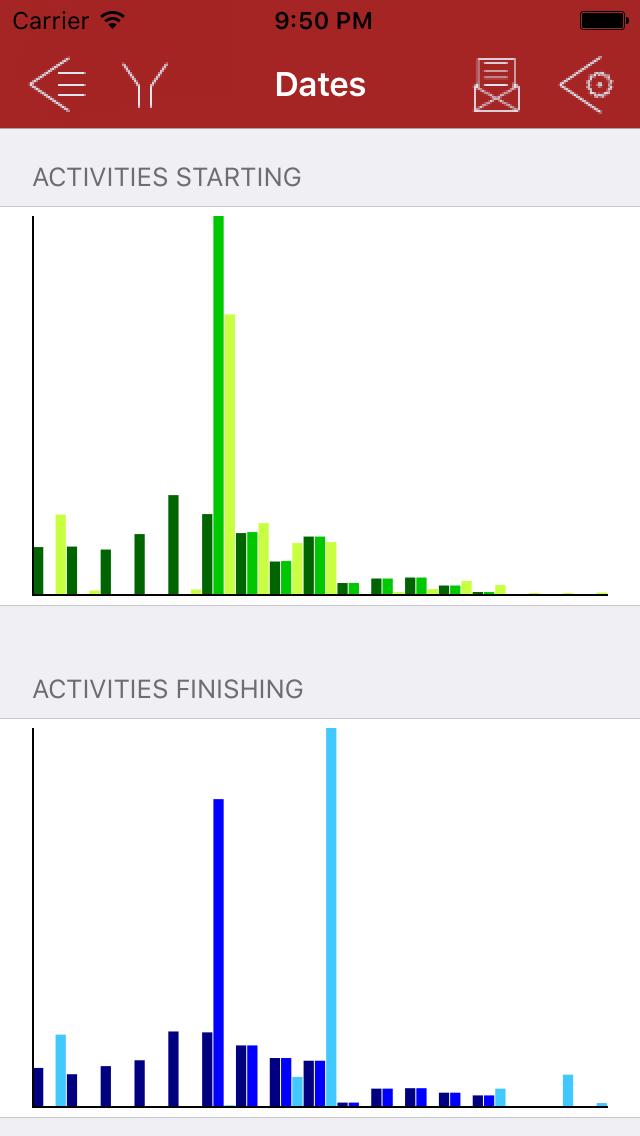 |
See activity start finish distribution
Identify invalid dates
Find resource task misalignments
|
duration
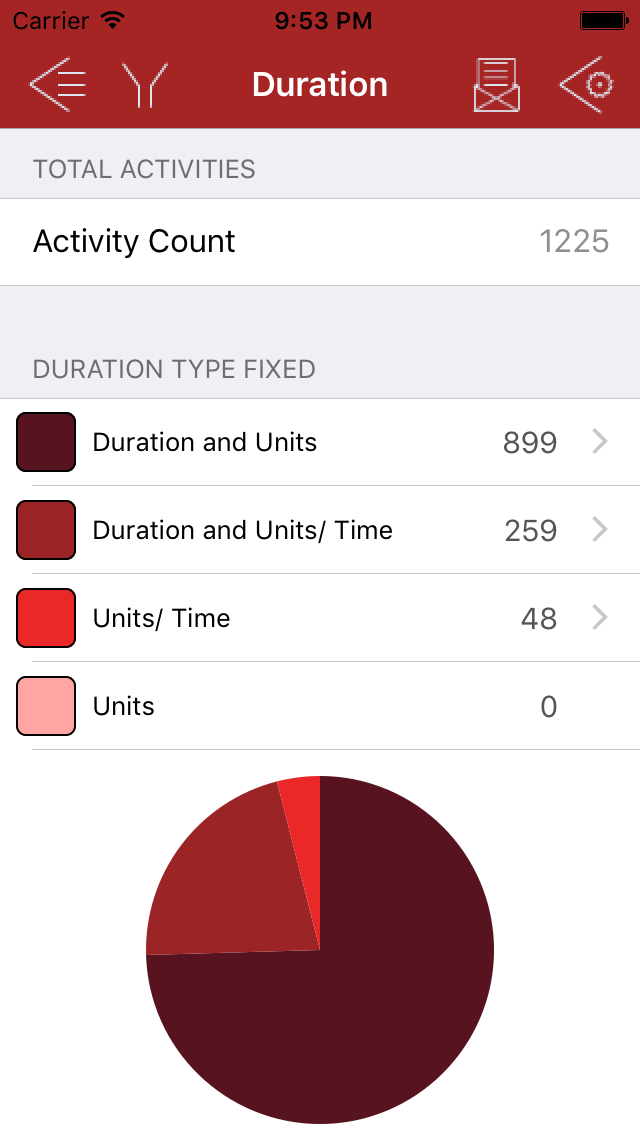 |
See activity duration types
Review remaining or planned duration distribution
|
logic
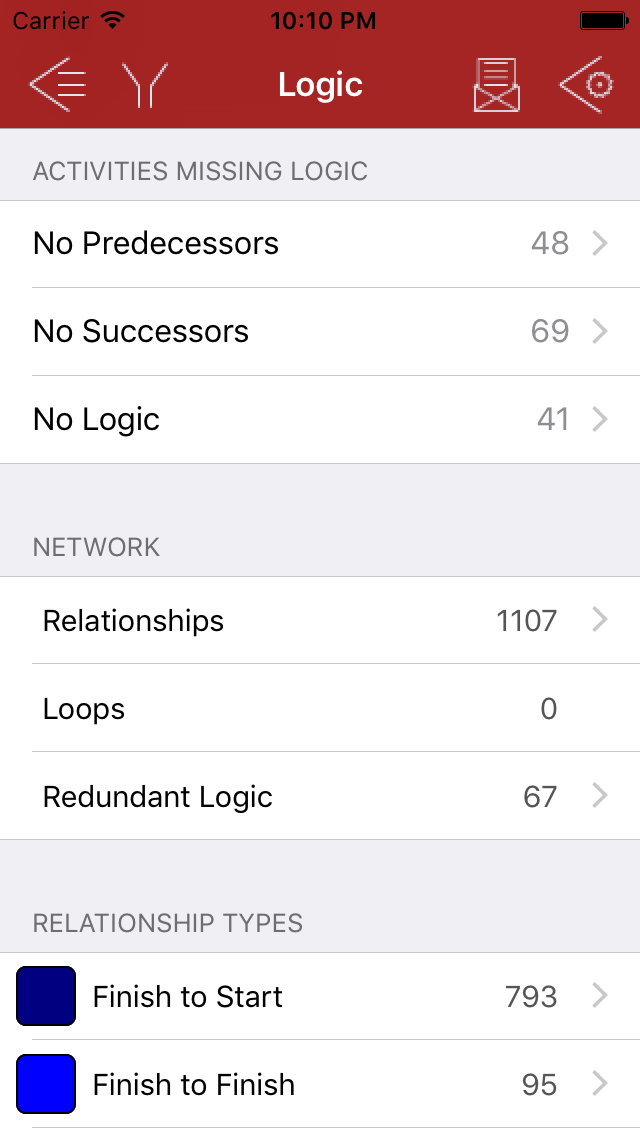 |
Find activities without predecessors and succesors
See loops
Identify redundant logic
Review relationship types
Consider leads and lags
Find logic concentrations
|
constraints
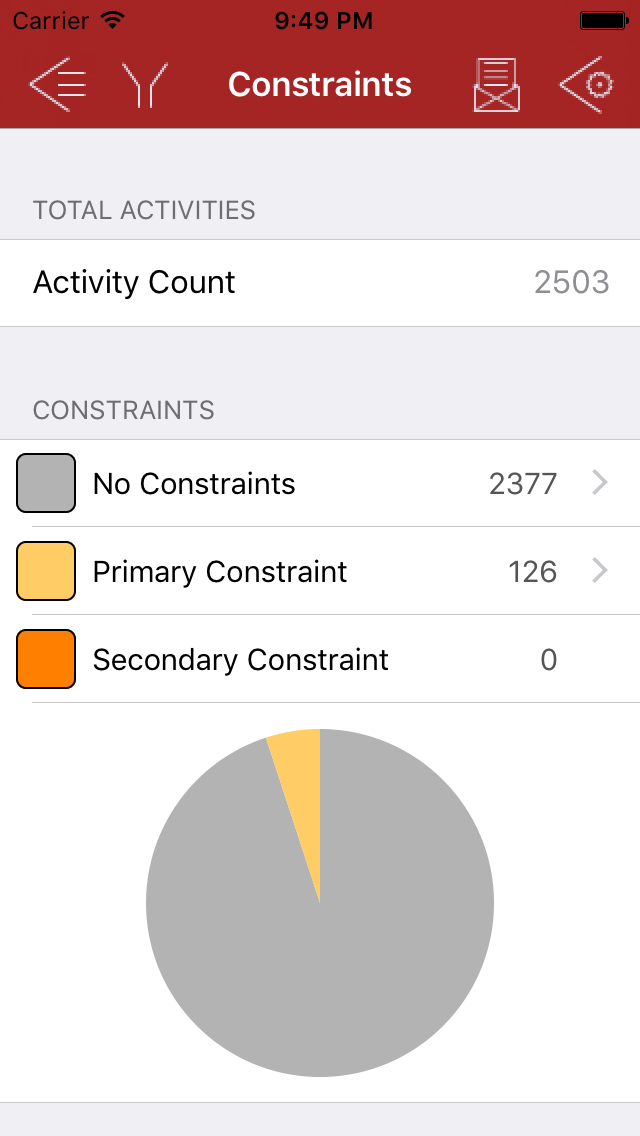 |
Find constrained activities
|
actvity types
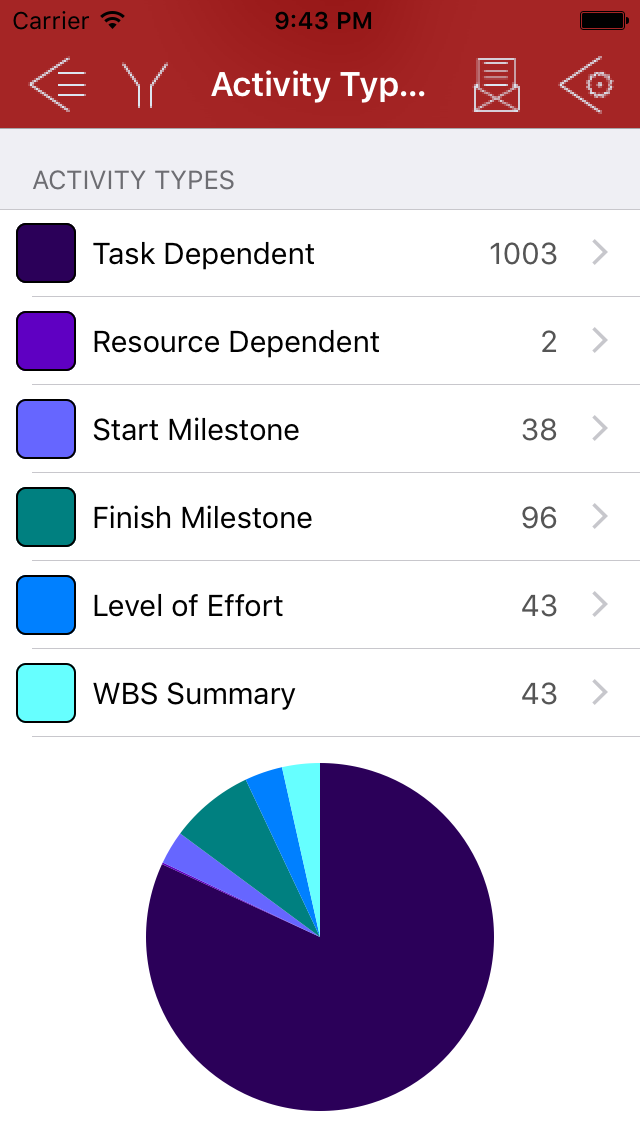 |
Review activity status
Check activity types
See percent complete types
List duration types
|
|